№ 7
June 3, 2018
Monitoring your home lab with Grafana in Docker
I have a rather complex mix of physical hosts, KVM guests, and Docker containers in my home lab that I’d like to monitor the health of.
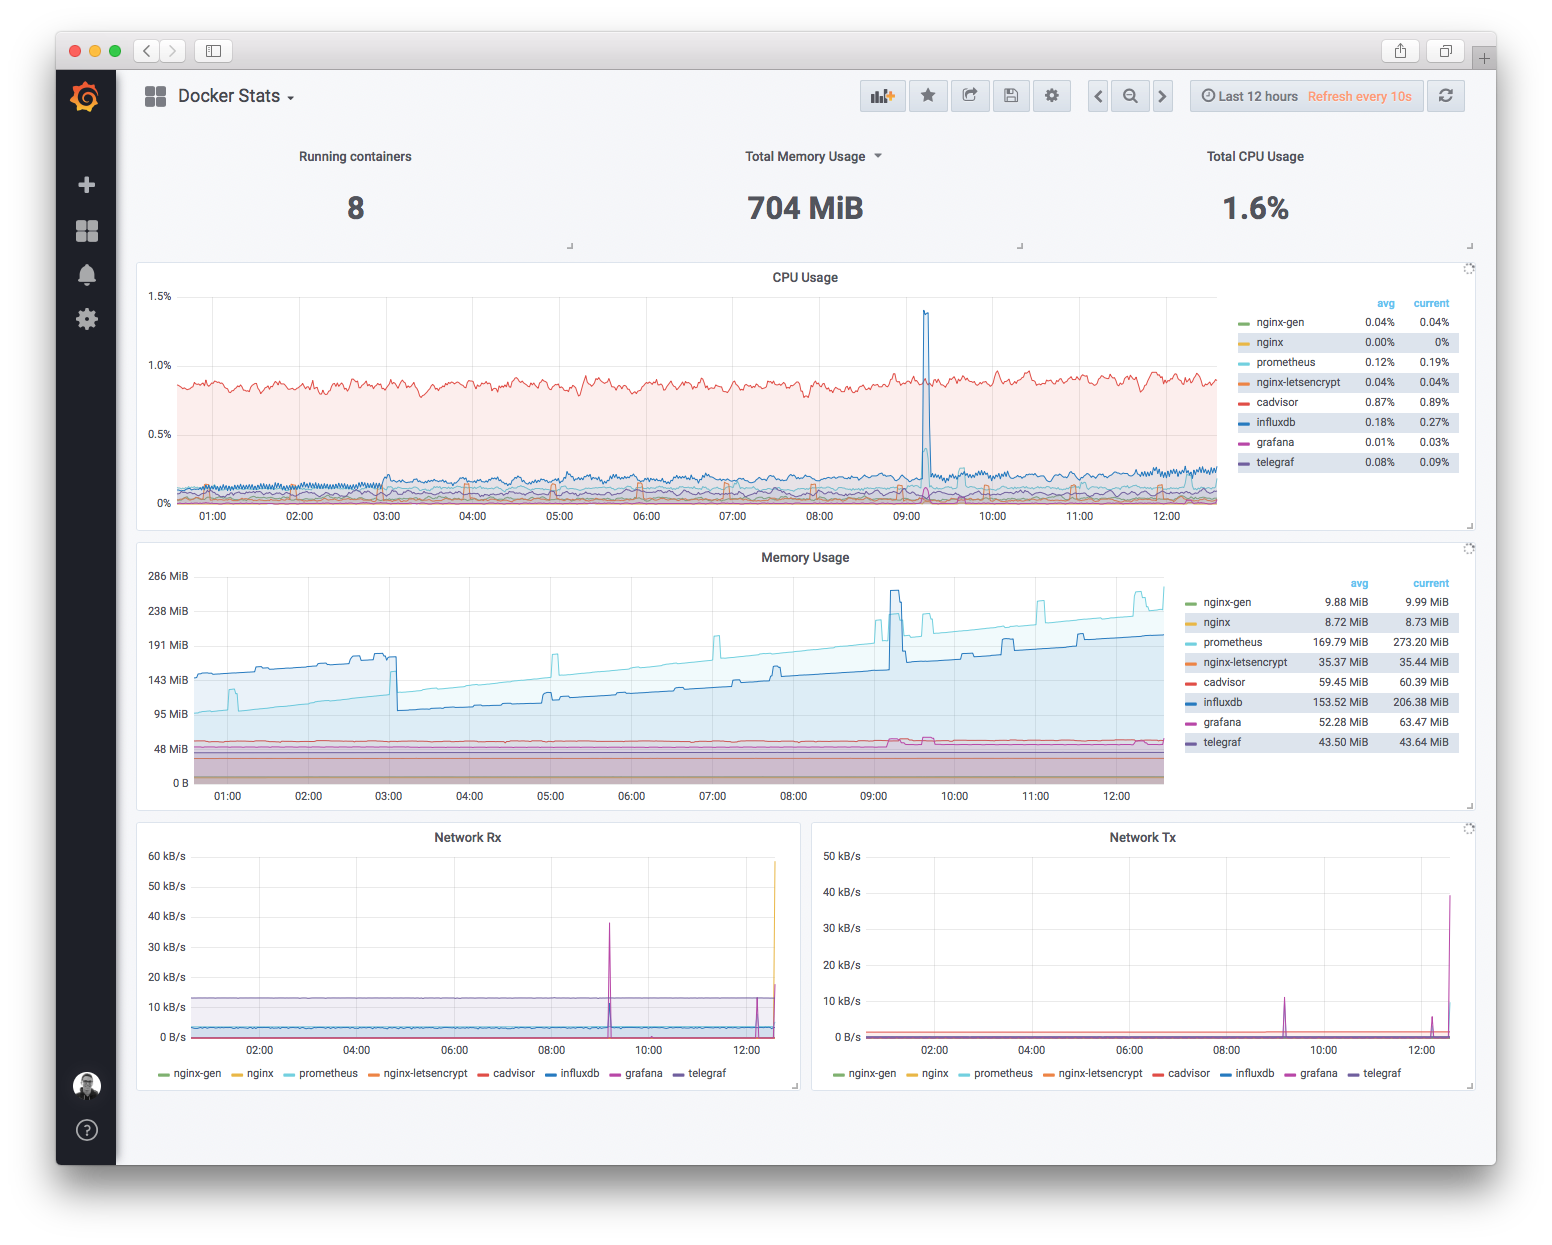
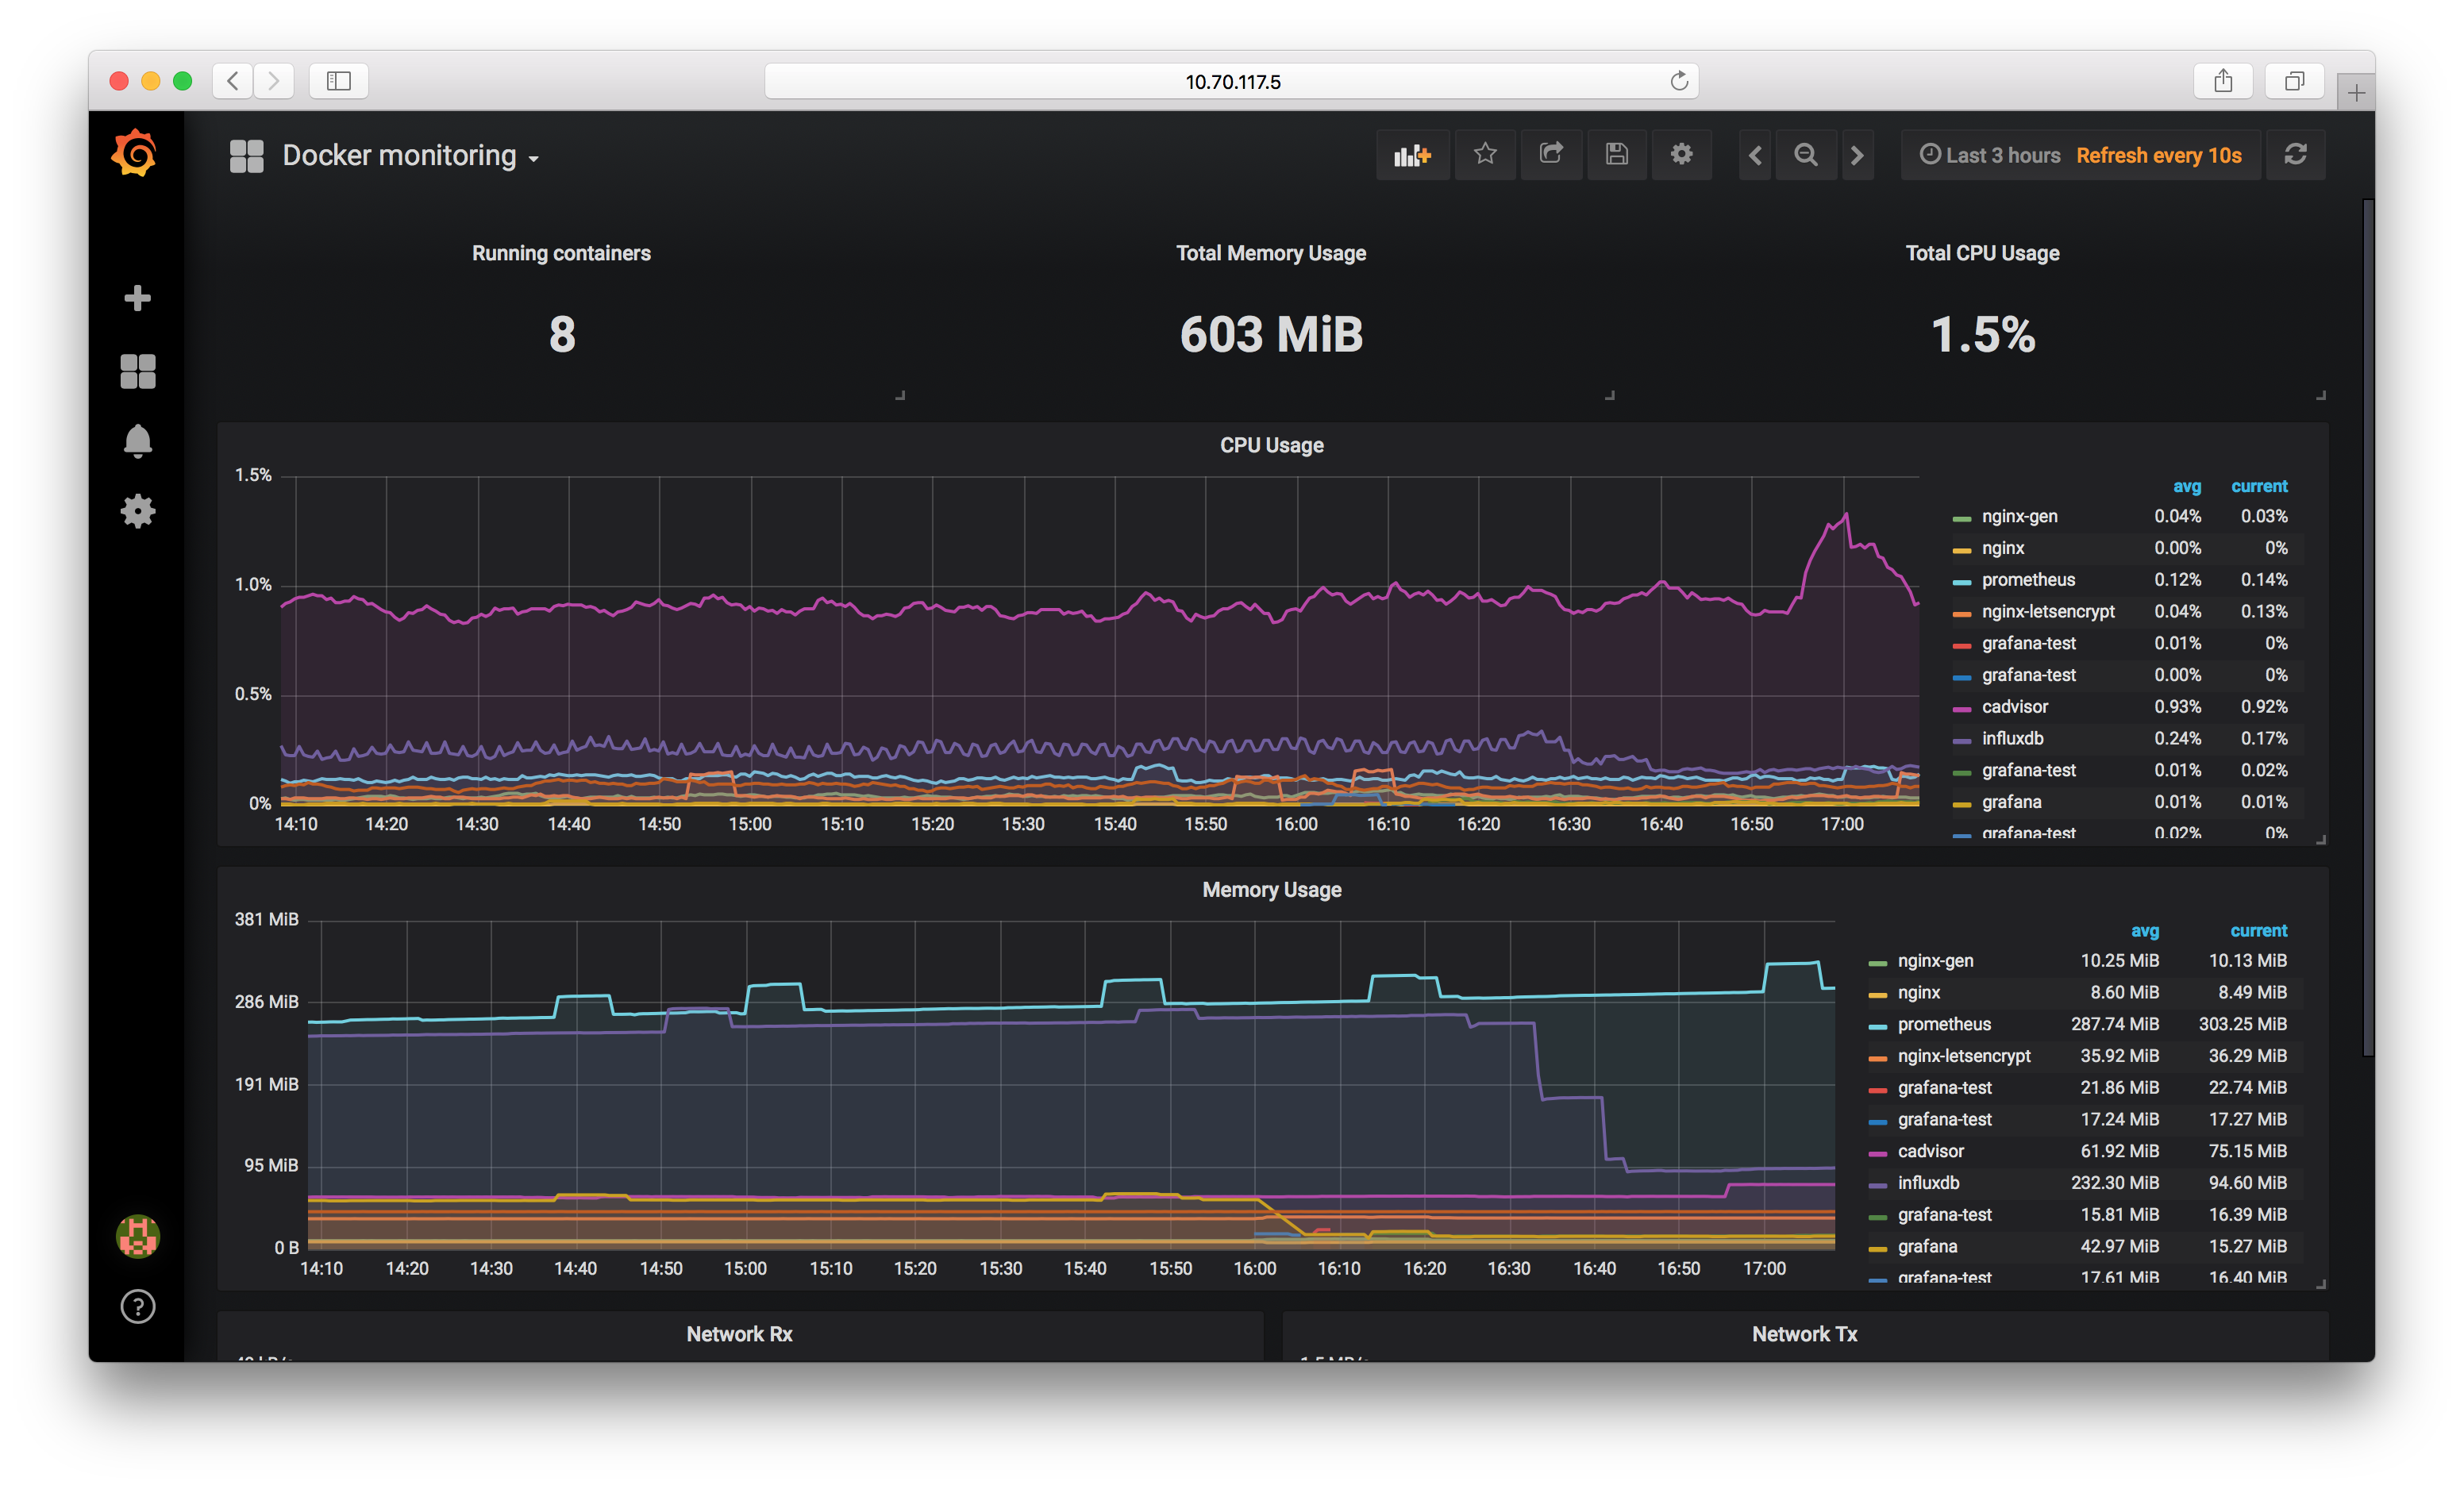
I use Grafana for this, and after taking the steps in this blog post, the final result will look something like this:
Setting up Grafana
Grafana is an open source metrics dashboard. I’ve chosen to run Grafana in a Docker container to reduce the memory footprint and avoid the maintenance overhead of having another host just for this application. Grafana itself is a standalone application that requires little to no configuration, other than how to fetch the metrics data. We’ll be storing the metrics in proper data stores later in this blog post.
We’re going to start by creating two Docker volumes. One for Grafana’s configuration file, and another for its persistent data (like the dashboards and their layouts). Volumes are handy because they counteract the ephemeral nature of containers; when a container is destroyed but brought back up with the same volume, everything is just as you left it.
$ sudo docker volume create grafana-config
$ sudo docker volume create grafana-data
This will result in two new folders on your Docker host: /var/lib/docker/volumes/grafana-config/_data/ and /var/lib/docker/volumes/grafana-data/_data/. They’ll start out empty, but once we get Grafana running, you’ll notice data will start to appear in them.
After that, we can run the following command to add the container:
$ sudo docker run \
  --name=grafana \
  --restart=always \
  --detach=true \
  --publish=3000:3000 \
  --volume=grafana-data:/var/lib/grafana \
  --volume=grafana-config:/etc/grafana \
  -e "GF_SECURITY_ADMIN_PASSWORD=hKg9szzXaQ7NkiRbT97n" \
  grafana/grafana
This command is relatively intuitive, but to break it down piece by piece:
sudo docker run: Docker needs to run as root, so we preface the command withsudo.--name=grafana \: The name of the container and how we’ll reference it in later commands.--restart=always: This flag denotes that we want the system to always reboot the container in the event of a failure, as well as automatically when Docker starts.--detach=true: We’ll want this container to run in the background in “detached” mode.--publish=3000:3000: This will publish the internal port 3000 on the host’s port 3000. This is the port that Grafana runs on, and how we’ll access the web interface.--volume=grafana-data:/var/lib/grafana: This mounts thegrafana-datavolume that we created earlier in container’s filesystem at/var/lib/grafana, which is defined in theDockerfileas where it will look for the Grafana data.--volume=grafana-config:/etc/grafana: This mounts thegrafana-configvolume that we created earlier in the container’s filesystem at/etc/grafana, which is defined in theDockerfileas where it will look for the Grafana configuration.-e "GF_SECURITY_ADMIN_PASSWORD=hKg9szzXaQ7NkiRbT97n": This sets an environment variable that will be used by the container to set the default admin user’s password. You should change this value.
Now Grafana should be running on port 3000 of your Docker host.
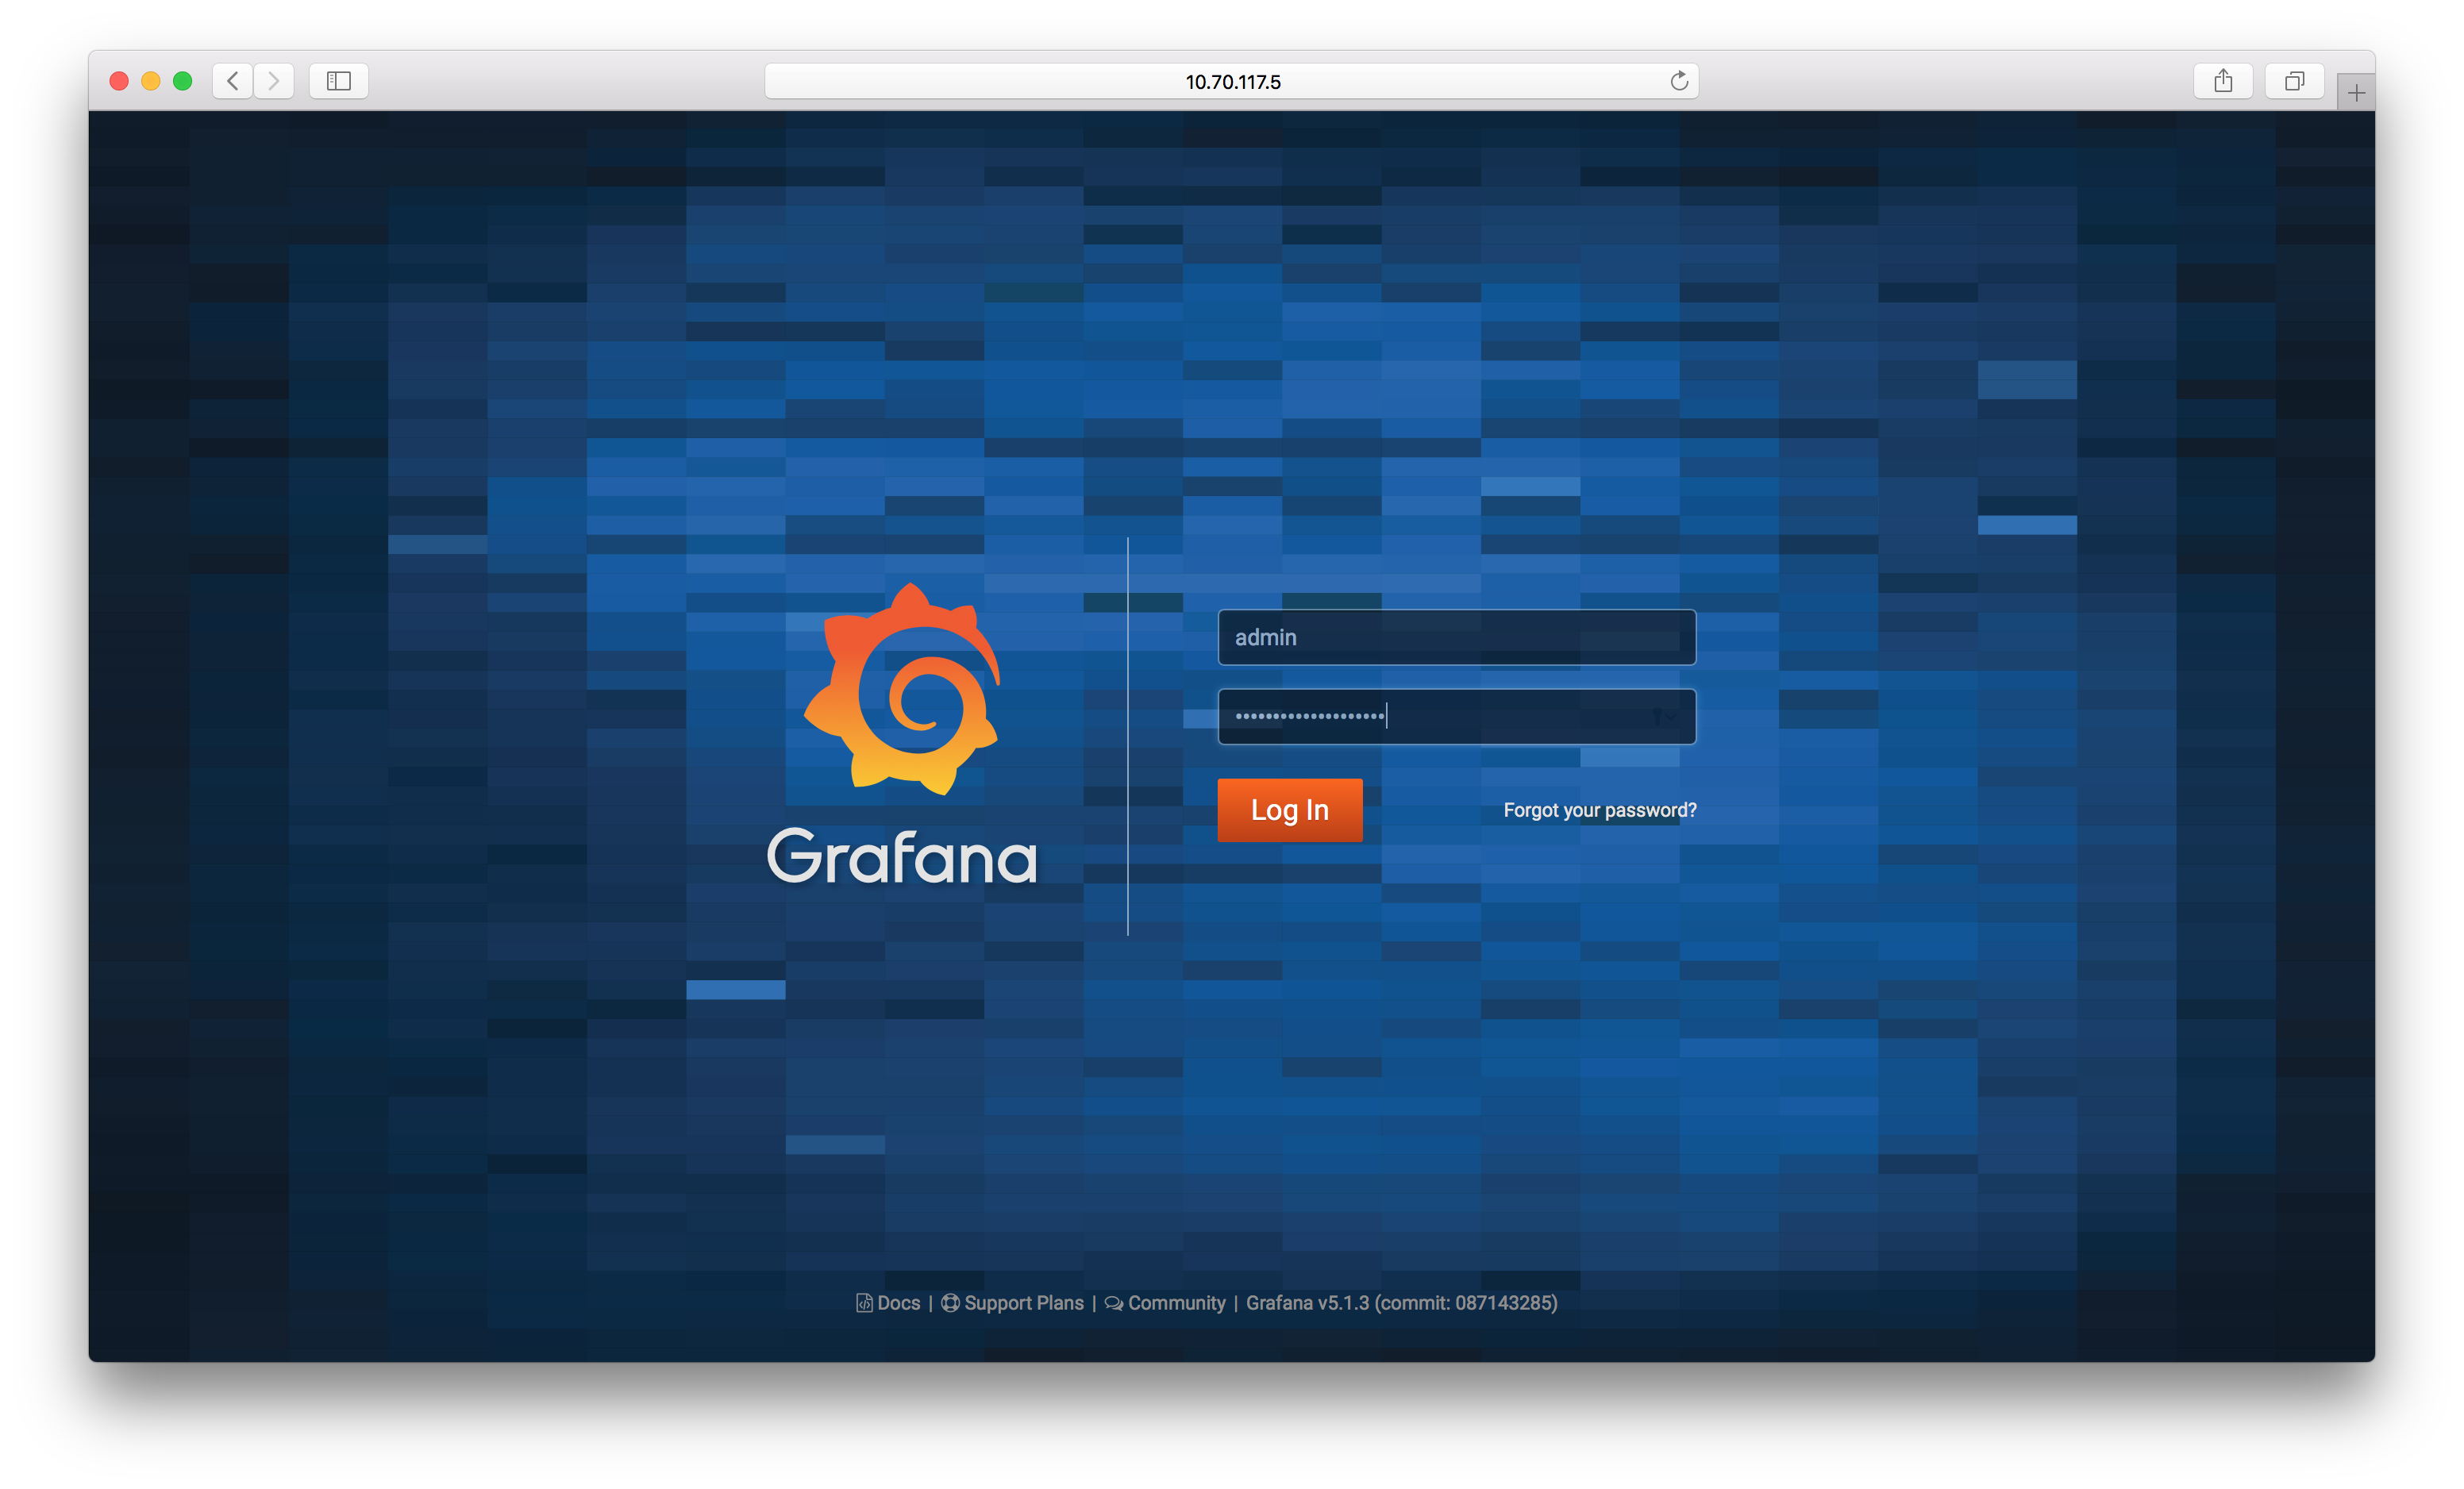
And you can sign in using the admin account and the password you set above:
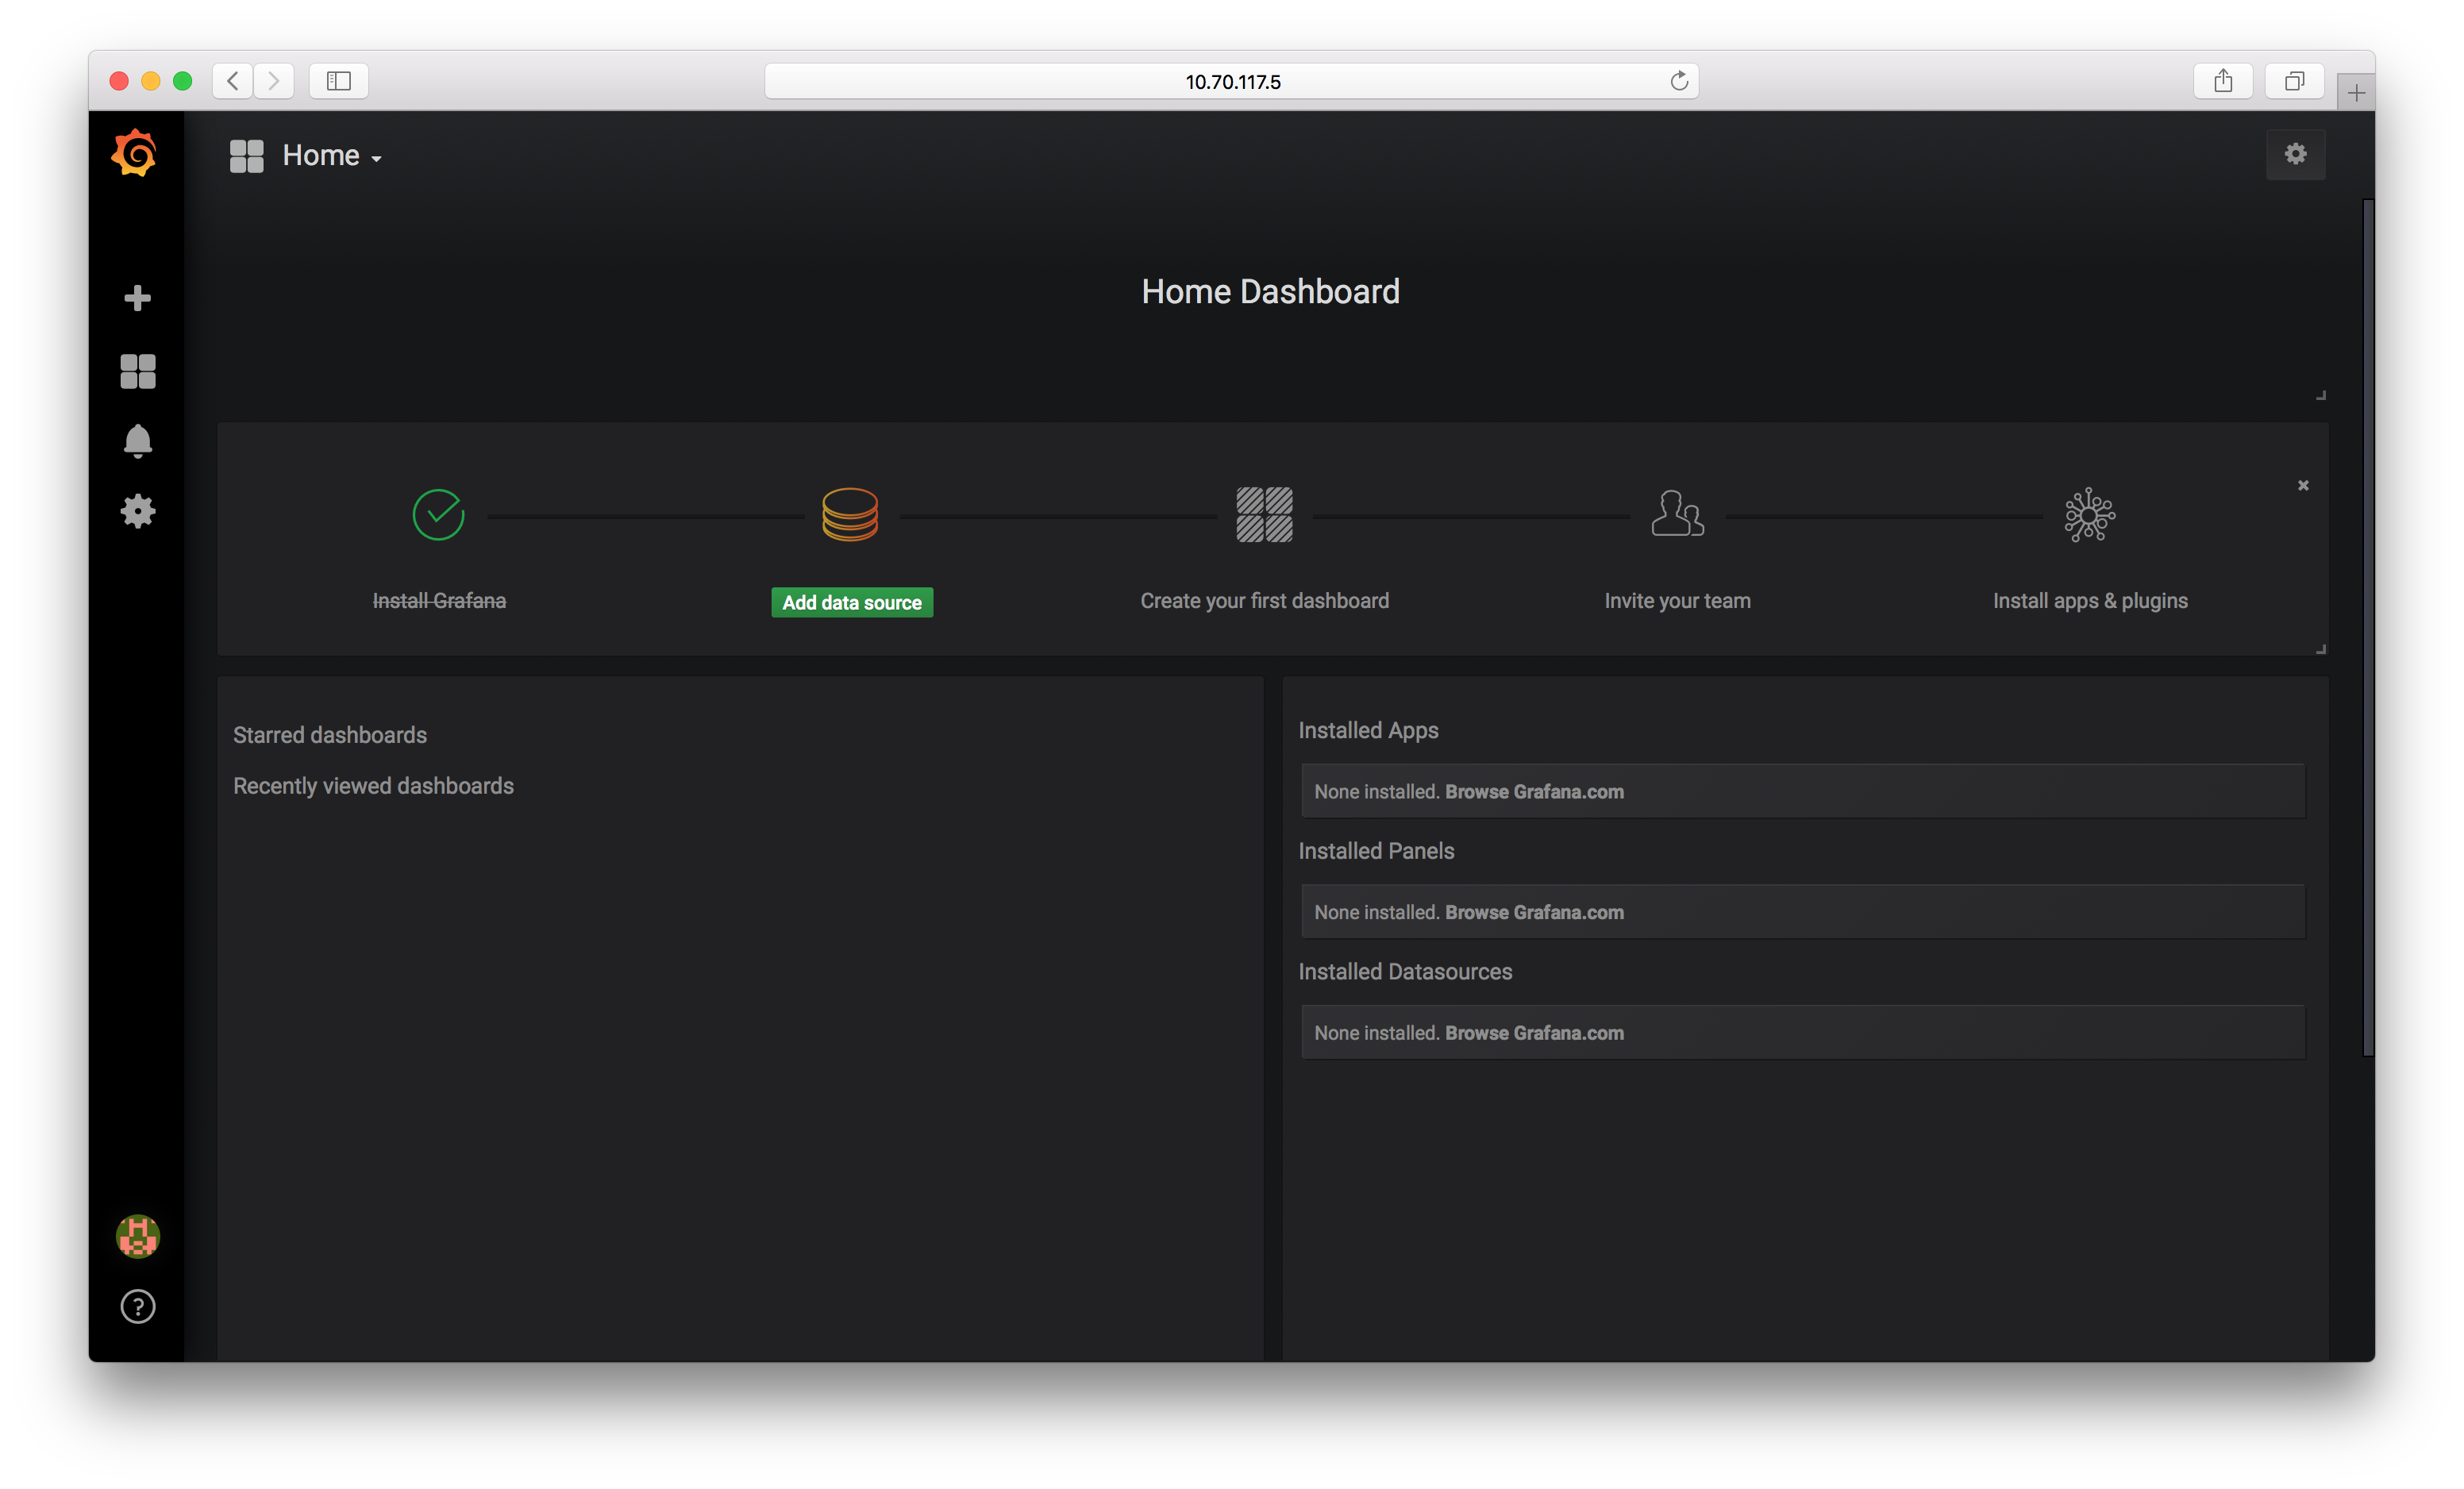
Our next step is to get some metrics into Grafana.
Monitoring Docker
cAdvisor
Container Advisor, better known as cAdvisor, is an open source tool to monitor the usage and performance characteristics of running containers. We’ll be using it inside of Docker to measure the performance of itself and its peer containers.
Running the following command will bring it up on port 8080:
$ sudo docker run \
  --name=cadvisor \
  --restart=always \
  --detach=true \
  --publish=8080:8080 \
  --volume=/:/rootfs:ro \
  --volume=/var/run:/var/run:rw \
  --volume=/sys:/sys:ro \
  --volume=/var/lib/docker/:/var/lib/docker:ro \
  --volume=/dev/disk/:/dev/disk:ro \
  google/cadvisor:latest
You’ll notice that there are a fair number more volume arguments in this command, and that’s because we’re mounting access to the Docker host’s filesystem so that it can read various metrics from it.
You can test whether this was successful by looking at port 8080 of your Docker host in a browser:
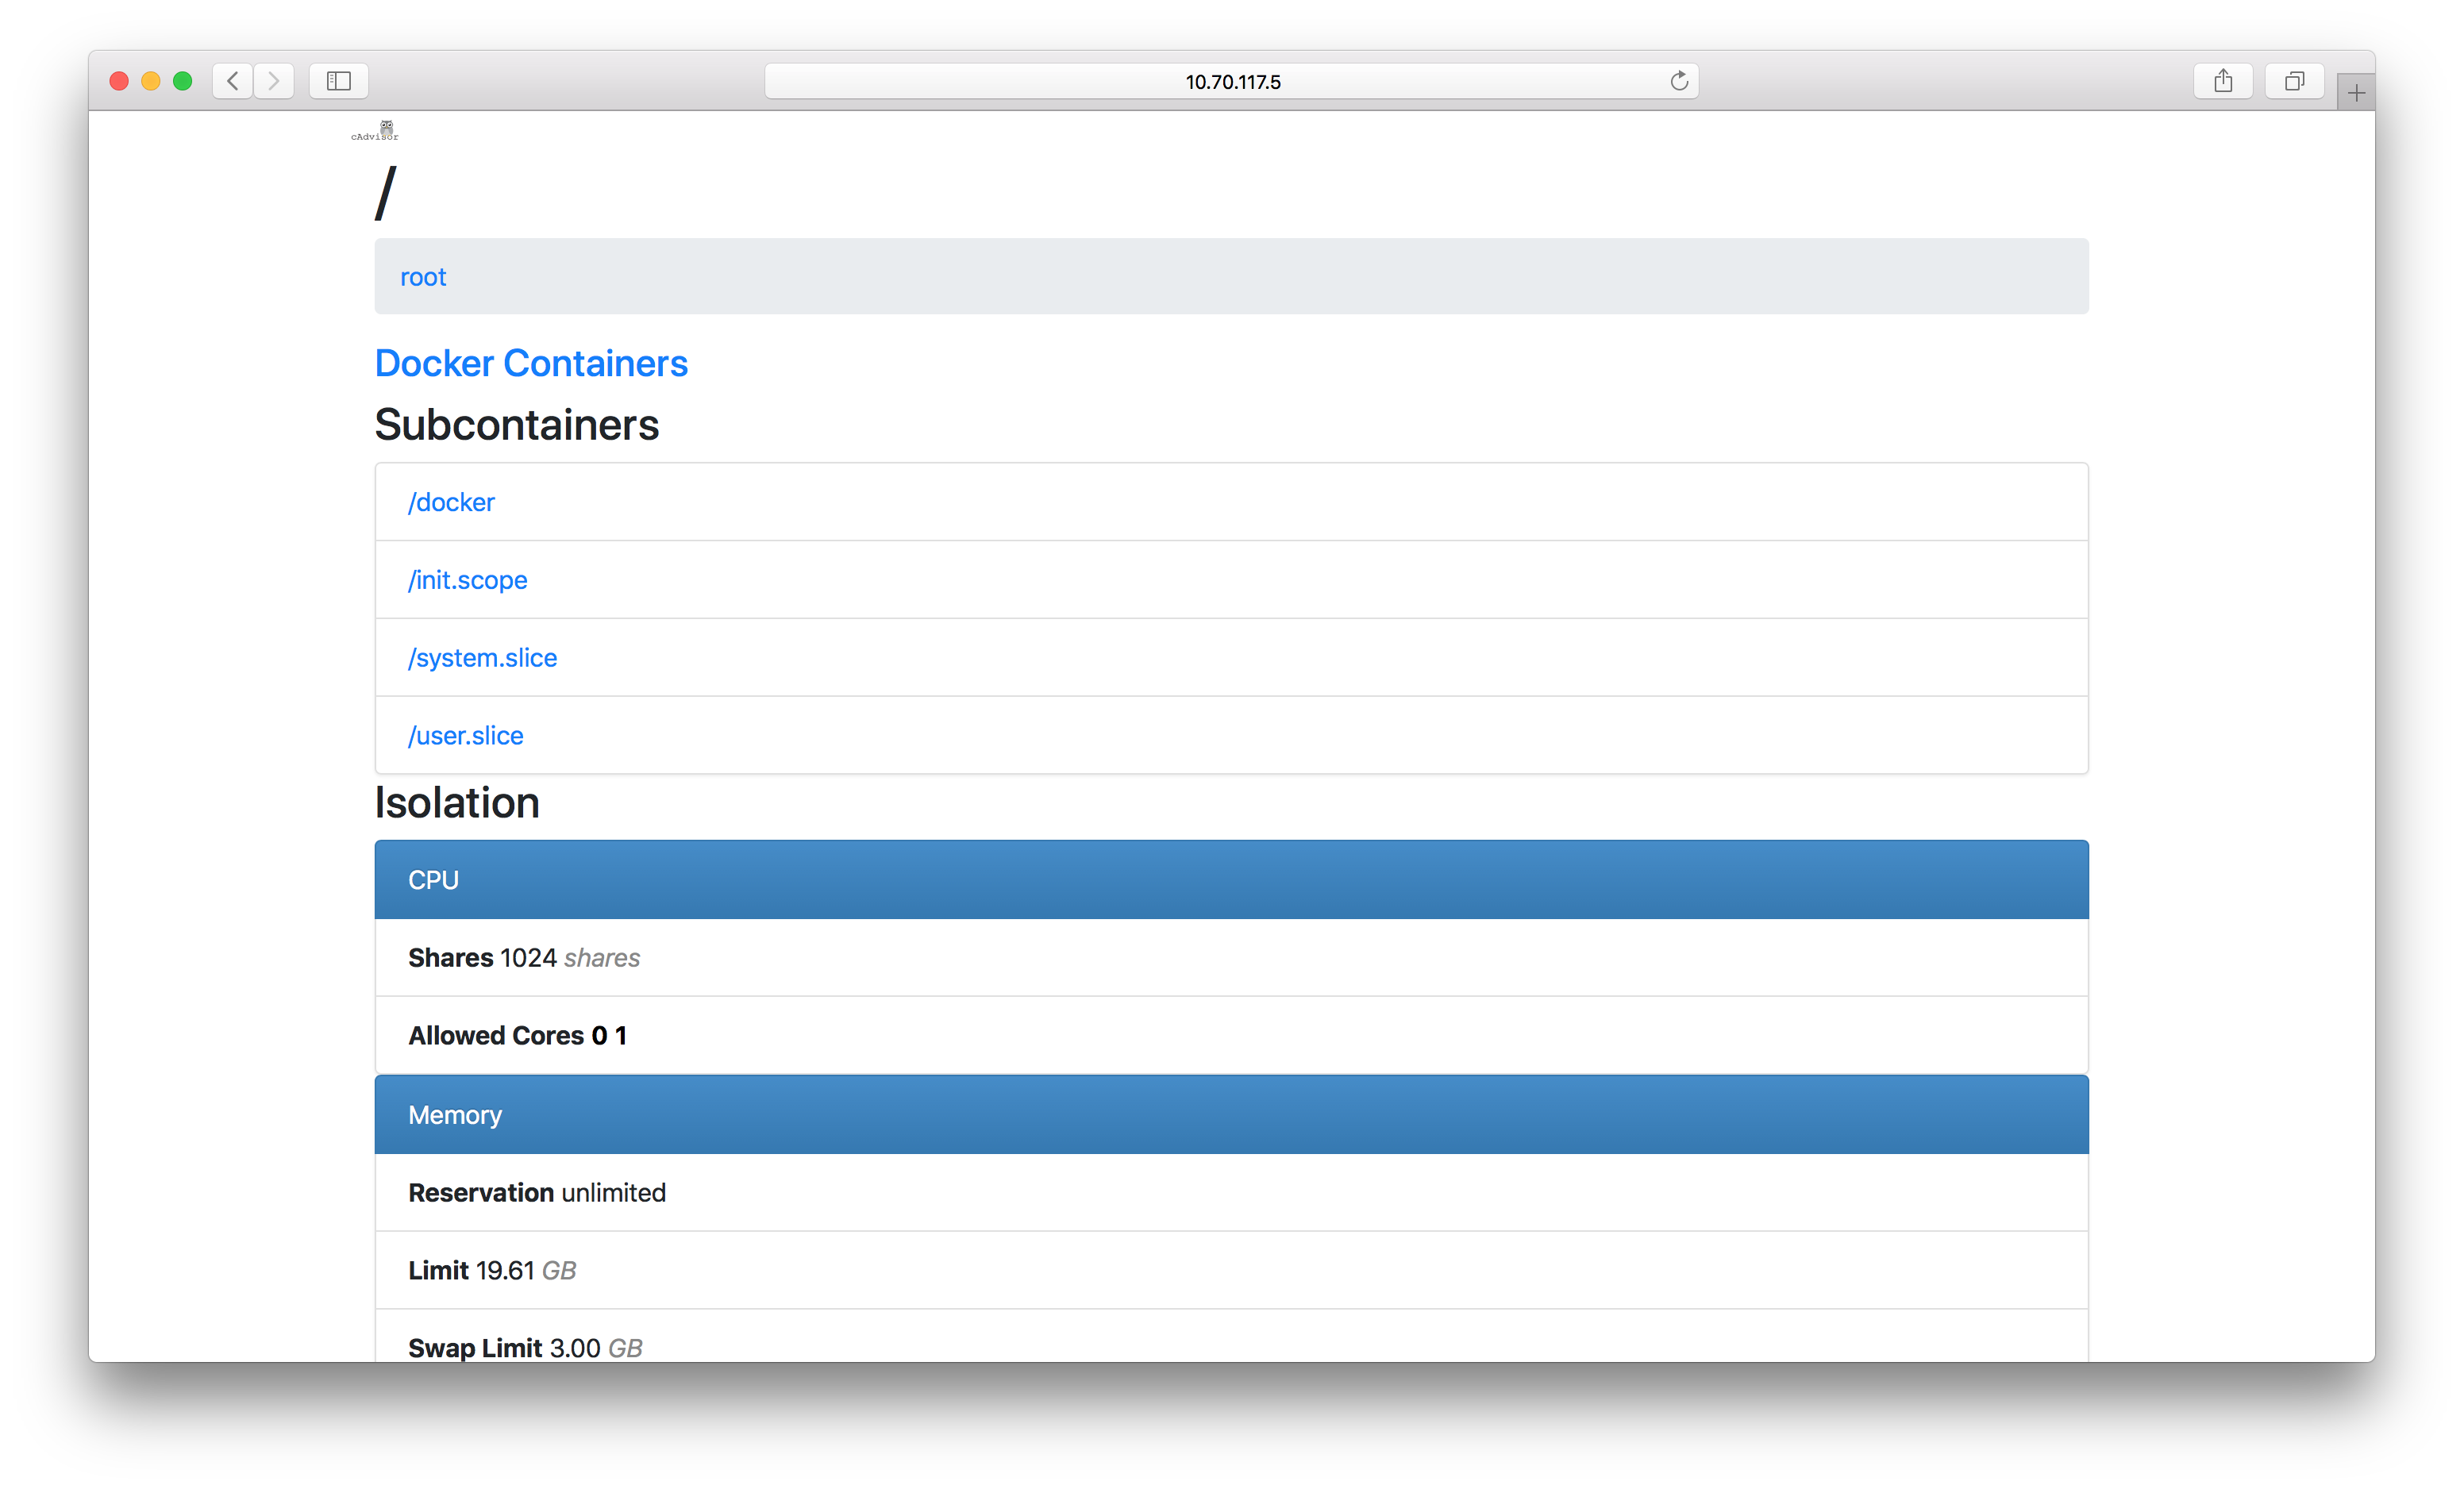
And if you have any trouble, docker logs -f cadvisor is an invaluable command to help debug.
Prometheus
The last step is to pull the data out of cAdvisor and into a proper datastore. We’ll be using Prometheus for this.
We’ll start off by creating two volumes, one for Prometheus’ config and another for the actual metrics it’ll be collecting.
$ sudo docker volume create prometheus-config
$ sudo docker volume create prometheus-data
Next, we’ll need to change the ownership of the folders that Prometheus will be writing to on the host. This is because this Docker container runs as the user nobody, so we need to ensure it has access.
$ sudo chown -R nobody /var/lib/docker/volumes/prometheus-config
$ sudo chown -R nobody /var/lib/docker/volumes/prometheus-data
And finally, we can create the Prometheus container with:
$ sudo docker run \
  --name=prometheus \
  --restart=always \
  --detach=true \
  --publish=9090:9090 \
  --volume=prometheus-config:/etc/prometheus \
  --volume=prometheus-data:/prometheus \
  prom/prometheus \
  --config.file=/etc/prometheus/prometheus.yml \
  --storage.tsdb.path=/prometheus
Now that Prometheus is running, we’ll need to start getting the data out of cAdvisor and into it. In order to do so, we’ll edit prometheus’ configuration file and teach it how to communicate with cAdvisor. Edit the following file, it will look something like below:
/var/lib/docker/volumes/prometheus-config/_data/prometheus.yml
# my global config
global:
  scrape_interval:     15s # Set the scrape interval to every 15 seconds. Default is every 1 minute.
  evaluation_interval: 15s # Evaluate rules every 15 seconds. The default is every 1 minute.
  # scrape_timeout is set to the global default (10s).

# Alertmanager configuration
alerting:
  alertmanagers:
  - static_configs:
    - targets:
      # - alertmanager:9093

# Load rules once and periodically evaluate them according to the global 'evaluation_interval'.
rule_files:
  # - "first_rules.yml"
  # - "second_rules.yml"

# A scrape configuration containing exactly one endpoint to scrape:
# Here it's Prometheus itself.
scrape_configs:
  # The job name is added as a label `job=<job_name>` to any timeseries scraped from this config.
  - job_name: 'prometheus'

    # metrics_path defaults to '/metrics'
    # scheme defaults to 'http'.

    static_configs:
      - targets: ['localhost:9090']
We’ll want to add a new - job_name entry for cAdvisor:
  - job_name: 'cadvisor'
    static_configs:
      - targets: ['10.70.117.5:8080']
You’ll want to update the IP address that I used above to point to your Docker host. And that’s it! Metrics should start to be pulled from cAdvisor into Prometheus shortly.
Let’s focus on adding Prometheus to Grafana and then setting up a dashboard.
Adding a datastore to Grafana
Head back over to Grafana and click the “Add data source” on the homepage. You should see something that looks like this:
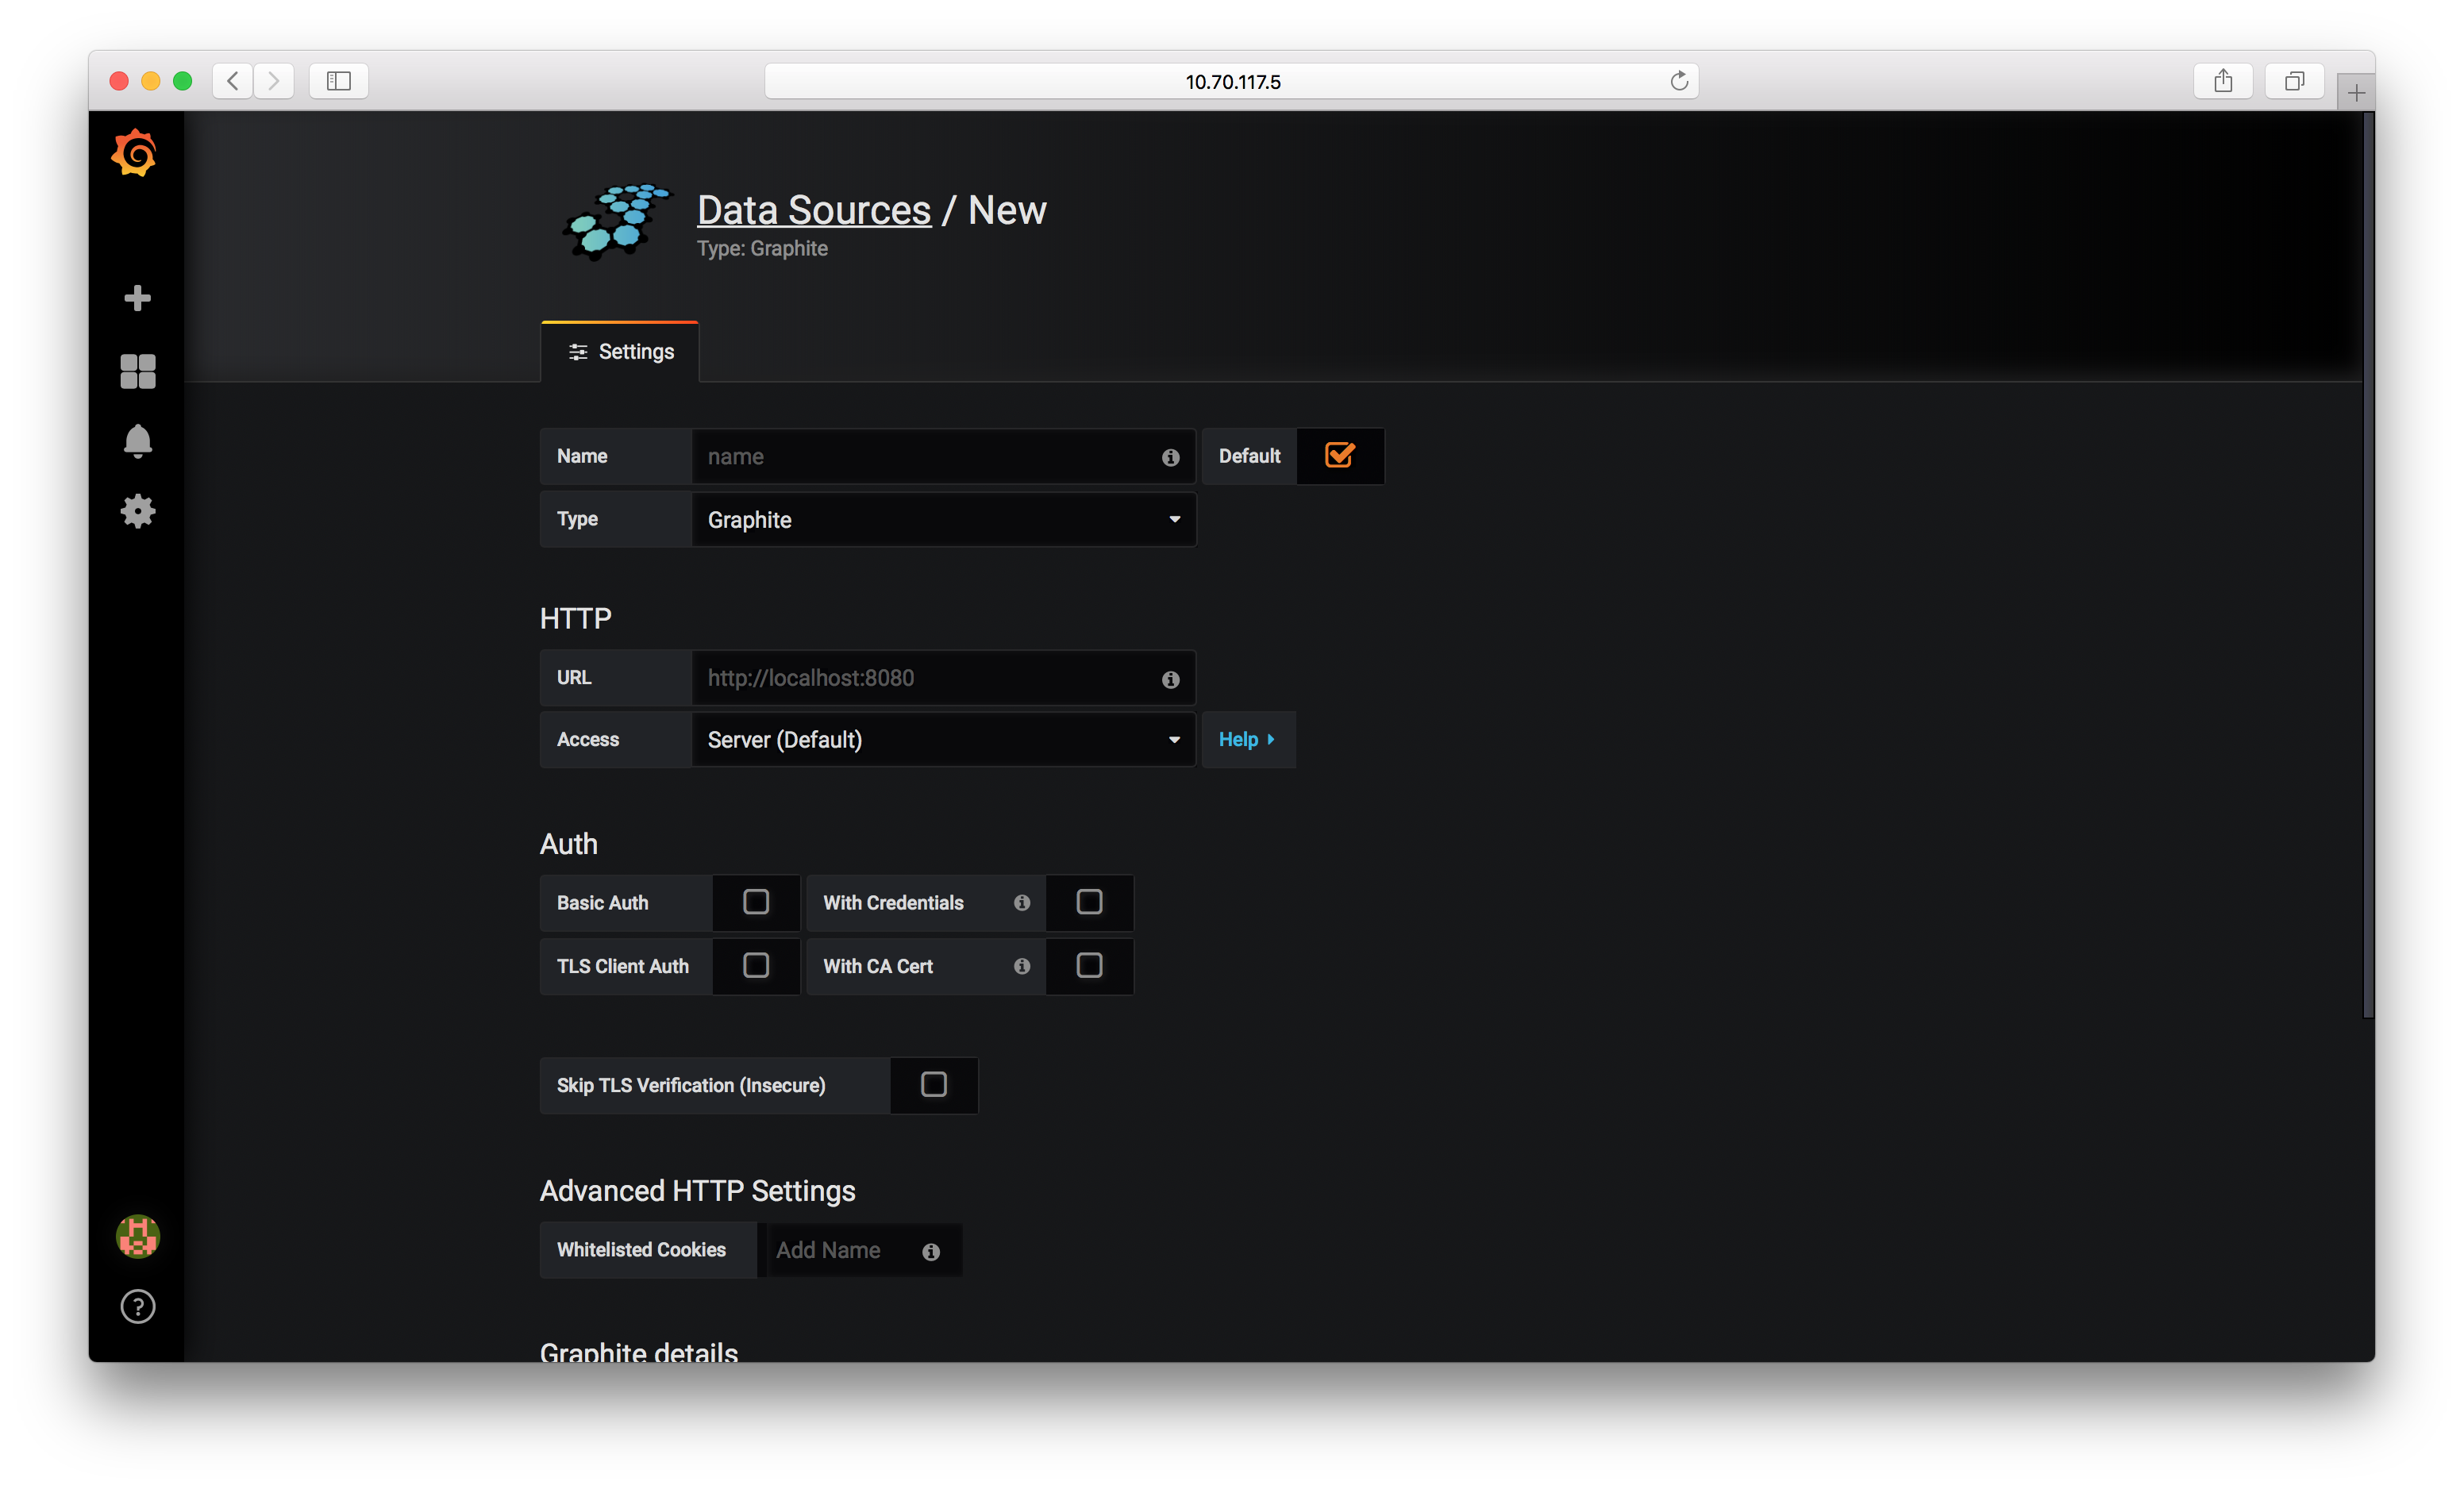
We’ll use the following values to configure Prometheus:
- Name: Prometheus
- Type: Prometheus
- URL: 10.70.117.5:9090 (again, you’ll want to change this to your IP)
Then scroll down to the bottom and choose “Save and test”. If all goes well, a flash message should appear on the top right of the screen that says “Datasource updated”.
Next, click the large + sign on the top left of the screen and choose “Import”. There’s a huge number of different preconfigured dashboards to choose from. I’m a fan of this one. We can type in 193 for the “Grafana.com Dashboard” value, hit tab, and then choose our Prometheus source, and then you should see your dashboard 🎉.
Monitoring Physical Hosts
Physical hosts can be monitored with a tool from the same folks that make Prometheus called Node Exporter. This is a small binary that runs as a daemon in the background, and then Prometheus comes along and pulls the data.
To install it, find the latest version here for your OS. I’ll use 0.16.0 as an example:
wget https://github.com/prometheus/node_exporter/releases/download/v0.16.0/node_exporter-0.16.0.linux-amd64.tar.gz
tar xzf node_exporter-0.16.0.linux-amd64.tar.gz
sudo cp node_exporter /usr/local/bin
Then, we can schedule it to run on boot and in the background. Edit this file:
/etc/systemd/system/node_exporter.service
[Unit]
Description=Node Exporter

[Service]
User=root
ExecStart=/usr/local/bin/node_exporter $OPTIONS

[Install]
WantedBy=multi-user.target
And then enable and start the service.
sudo systemctl enable node_exporter.service
sudo systemctl start node_exporter.service
From there, we just need to tell Prometheus to start looking for the new physical host that node exporter is running on.
Back in our Prometheus config:
/var/lib/docker/volumes/prometheus-config/_data/prometheus.yml
  - job_name: 'node_exporter'
    static_configs:
      - targets: ['containers.brooks.network:9100', 'nuc7i5.brooks.network:9100', 'unifi.brooks.network:9100', 'homebridge.brooks.network:9100']
And then metrics should start reporting!
— © 2021. All rights reserved. —